Alert Rules
Admins manage rule-based monitoring from Admin → Alerts. Rules evaluate container logs, Docker events, Kubernetes events, and CPU or memory samples, then deliver to configured notification channels.
Rule types
Logs
Pattern matching on stdout/stderr. Example: 10 ERROR lines within 2 minutes.
Events
Restart loops, OOM kills, and unhealthy health checks.
Metrics
CPU or memory thresholds over a duration. Example: CPU above 90% for 5 minutes.
Kubernetes events
Warning events for crash loop backoff, image pull failures, failed scheduling, and OOM. Scope to pods or namespaces with the same pattern syntax as RBAC.
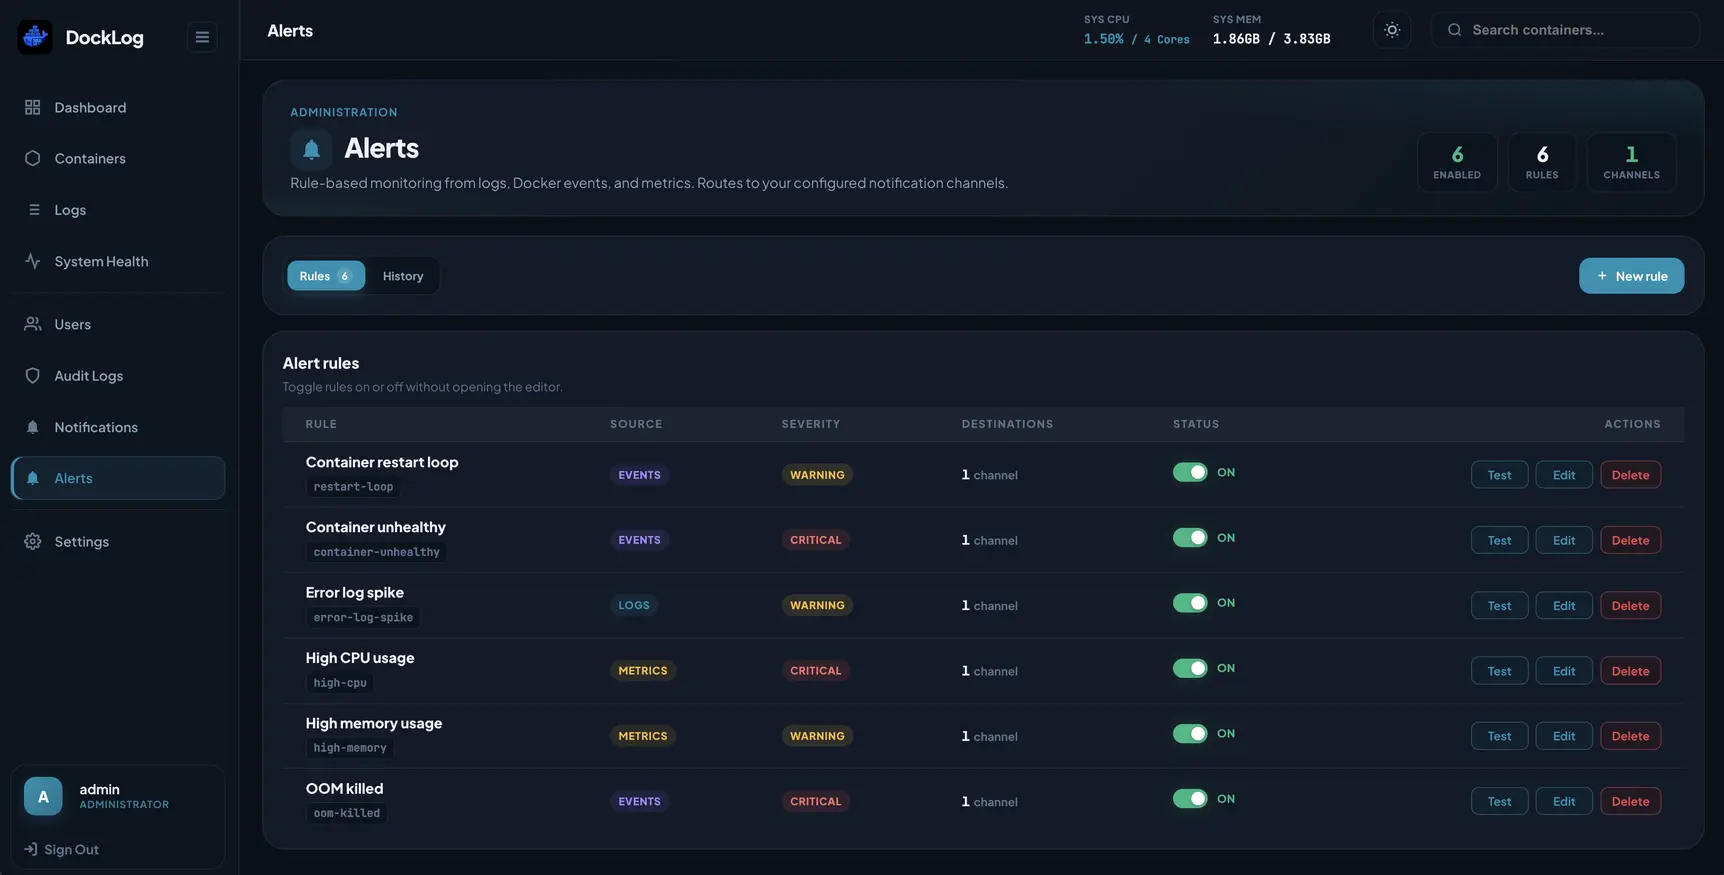
Alert rules
Built-in and custom rules for logs, events, and metrics.
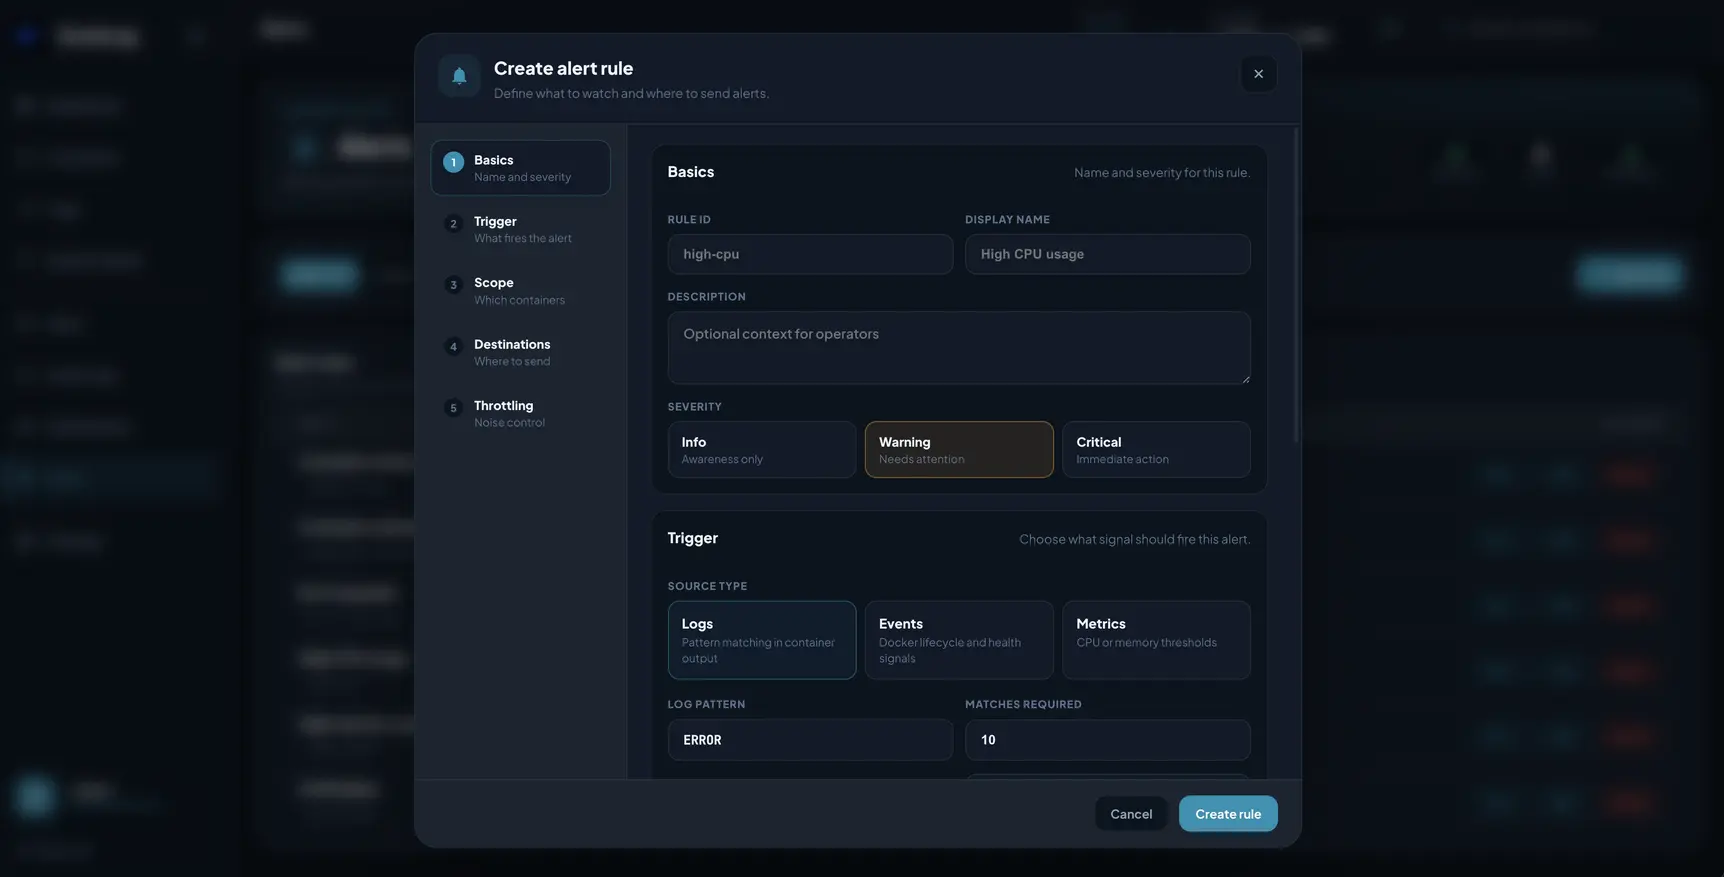
Create or edit a rule
Set the trigger, severity, and where alerts get sent.
Getting started
- Save at least one webhook under Admin → Notifications and turn on delivery.
- Enable Intelligent alerts on channels that should receive rule firings.
- Open Admin → Alerts, edit or enable a rule, and assign destinations.
- Use Test on a rule or channel before relying on it in production.
Pre-seeded rules
A fresh install seeds six starter rules (all disabled): container unhealthy, OOM killed, restart loop, high CPU, high memory, and error log spike.
Rule options
- Severity: info, warning, or critical.
- Scope: all workloads, specific names, or patterns (containers, namespaces, or pods).
- Destinations: one or more notification channels per rule.
- Throttling: cooldown, max alerts per hour, grouping window.
- Recovery: optional notifications when a condition clears.
Edit or suggest changes on GitHub.